
WHAT IF 5 IS THE NEW 5?
Or: Why PE Should Focus on Purchase Price Multiples.
In November 2023 we set out the Dodgeball Market thesis. We argued that the cycle was overextended, that “adjusted” numbers were flattering reality, and that our base case was a long grind through private market marks and valuations, with occasional discontinuities. We revisited the thesis in Dodgeball, the first issue of this newsletter, in January 2026.
Issue #5 opened with: “Private Equity worked exceptionally well but for reasons we will cover in a future VCO (hint: initial conditions matter), excess returns will be harder to come by in future.” That is the focus of this issue.
A note on intent: We write the Credit Observer to sharpen our own thinking and to hold ourselves publicly to the standards we set. This article is not a criticism of Bain, whose analysis we build on here, nor of any specific manager, nor of private equity as an asset class. Valuation is a genuinely hard problem and reasonable people can disagree on methodology. Our view is simply that greater clarity about where returns come from, and about the prices being paid to earn them, would benefit the entire industry as private markets mature. We welcome feedback and the debate.
Bain & Company published its Global Private Equity Report 2026 with a memorable headline: 12 is the new 5. A decade ago, a typical buyout needed 5% annual EBITDA growth to deliver a 2.5x MOIC, two and a half times the money back, over five years. Today the same target requires 12%. Why? Because rates are higher, leverage is lower, and multiple expansion has gone.
The implied conclusion is that GPs must work harder. Build operational systems. Engage in “value creation”. Deploy AI. That is a fair conclusion, and Bain is paid by the firms doing the buying to help them reach it.
Growing your way out is one option. Running the same math from the other end suggests another. 5% is what good businesses grow at organically. 12% is what you must assume to justify paying 14x for them. The honest lever is the entry price, not the growth rate.
Professor Ludovic Phalippou at Oxford’s Saïd Business School has just published The Science of Valuation in Private Markets. His central observation cuts through the Bain framing in one line: “In public markets, valuation means estimating what something is worth. In private markets, valuation means deciding the maximum you can pay while still reaching the return you promised your LPs.”
Bain is slowly arriving at the same place. Its 2026 report led with recovery and traction. Its Midyear update, barely three months later, opened with “Recovery deferred ... again” and called deals about as expensive as they have ever been. We called it Dodgeball in November 2023, Bain now calls it the Groundhog Day dynamic. Two and a half years into the grind we described, the common knowledge moment feels closer and the obvious gets harder to ignore each quarter.
Where Returns Come From
Strip a buyout down and the returns come from four drivers across two dimensions. The first one is the business: its value rises when revenue grows, when margins expand, or when a future buyer pays a higher multiple for the same earnings. The second dimension is the capital structure. Equity value grows through cash flow and debt repayment. Leverage acts as an amplifier. Four drivers in all: growth, margins, the multiple, and deleveraging.
For most of the last two decades the recipe worked exceptionally well: Debt was cheap, multiples rose steadily, and margins were expanding. A buyout could grow at an ordinary pace and still clear a strong return.
That era is over. Multiple expansion is gone. Cash deleveraging is weak, because today’s deals require heavy organic and inorganic re-investment to generate growth. And margins, far from expanding, sit at a record and are likelier to fall than rise. Three of the four drivers are spent or working against you, so the whole return now leans on the fourth, raw EBITDA growth. That, in a sentence, is what “12 is the new 5” really says. We take the drivers one at a time.
Reconciling Bain's Math
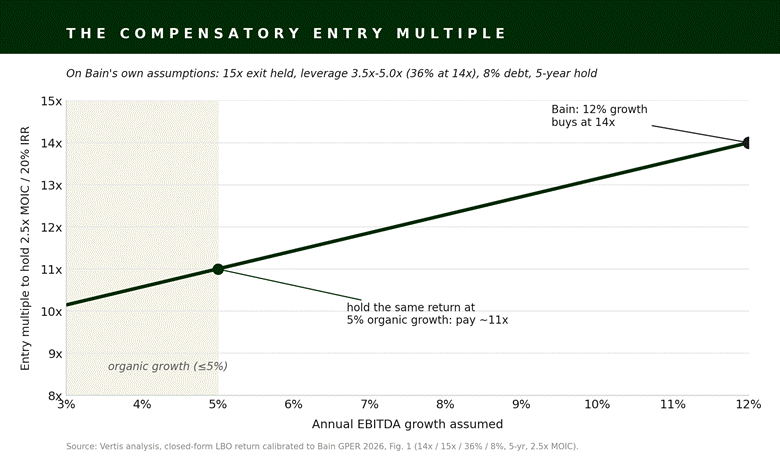
We reconciled Bain’s math from page 32 of their 2026 Global Private Equity Report. Their case assumes a 14.0x entry, a 15.0x exit, 36% leverage (or 5x EBITDA) at 8% interest, and a 5-year hold. To deliver a 2.5x MOIC against those inputs, EBITDA must grow 12% a year.
The 12% growth assumption is well above average. The 15.0x exit assumes a full turn of multiple expansion, off a base already at a historic high. That is the tell. Bain says plainly that multiple expansion has gone. Yet its own headline example still runs 14x going on 15x. Bain cannot make 12% clear 2.5x without keeping a turn of the very driver it has declared dead.
Let’s revisit the model at that same 14x entry multiple. Hold growth at 5% organic, which is a reasonable benchmark for a real-economy business at steady state, and set the exit multiple at 10.5x, which is the 20-year average global median large-cap entry multiple of roughly 9-10x, plus a small uplift to give Bain credit for the genuine sector-mix shift toward higher multiple capital light sectors.
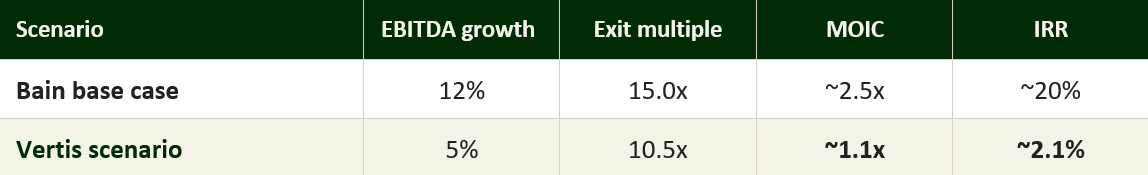
What if 5 is the new 5? Using Bain’s assumptions as before but adjusting the growth rate to 5% the compensatory entry price multiple in Bain’s example would need to be 11x to generate the same 2.5x MOIC. That’s a full 3 turns lower and obviously still assumes a 15x exit multiple (unachievable at that growth rate).
Margins
Bain’s 12% comes off today’s EBITDA, and today’s EBITDA sits on record margins. The S&P 500 net margin hit a record 13.2% in late 2025, then set a fresh record near 15% in the first quarter of 2026. The long-run average sits near 6%. Margins this far above history do not need to crash to hurt the math; they only need to drift. Shave a fifth off terminal EBITDA, well short of full reversion, and Bain’s exit value falls a fifth but the equity falls by a quarter, because the debt does not shrink with it. The 2.5x MOIC becomes roughly 1.9x and the 20% IRR lands around 13%. You are paying record multiples on top of record margins.
Multiple Expansion
Bain puts a number on it: steadily rising multiples powered over half of all buyout returns. That engine has stopped. Bain’s own GP survey now shows 79% expecting multiples to stay flat.
The chart behind Bain’s own words
Bain’s Midyear Report calls deals about as expensive as they have ever been and builds a deal cost index that sits in record territory. That is the right call. Here is the multiples series that puts it on a timeline.
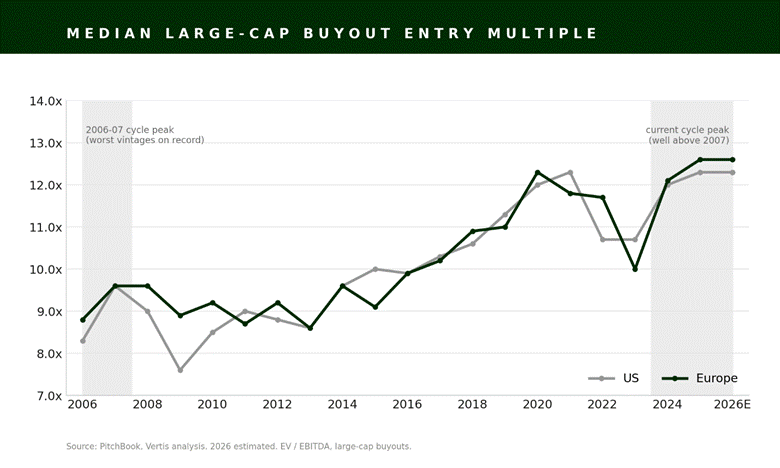
In 2006 and 2007 large-cap US buyouts traded at ~8.5x to 10.0x, with Europe marginally above the US in both years. Sponsors paid those prices because they believed the math worked. The 2005-2007 vintages went on to deliver some of the worst returns in modern private equity history. PitchBook’s vintage analysis is direct on the cause: when returns were lowest, for vintages 2005 through 2007, buyout multiples were at record levels, exceeding 10.0x (on PitchBook's global series) in 2006 and 2007. When returns were highest, for vintages 2001 through 2003, buyout multiples were below 8.0x. To steal the Apollo line: purchase price matters.
“Purchase price matters. It has a significant impact on how long it takes to exit an investment, and the value ultimately realized at exit.”
— Apollo, Private Equity Returns to Its Roots, January 2026
The price you pay at entry is the single largest determinant of the return you earn at exit. The original sin sits in the initial conditions.
Now look at the right side of the chart. US and EU large-cap multiples are at ~12.5x. The mega-deal segment is higher still. PitchBook reports that the median EV/EBITDA multiple for buyouts worth $1 billion or more reached 15.5x in 2024. Europe sits lower but is also at its own cycle high. Current entry levels are not just elevated. They are well past the 2006-2007 peak that produced the worst vintages in living memory.

Has sector mix done the work? Not most of it.
One reasonable pushback on our reconstructed entry multiples is that the rise in headline multiples reflects sector mix. Tech is a bigger share of buyout activity than it was a decade ago, and Tech trades at higher multiples. So part of the apparent multiple expansion is just composition. How much?
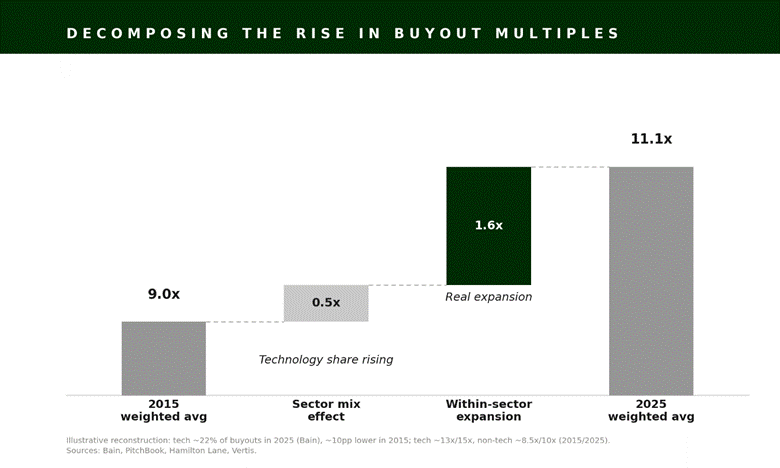
Assume tech trades at 15x and non-tech at 10x today, against 13x and 8.5x in 2015. At 2015 weights, the weighted average was around 9.0x. At 2025 weights, it is around 11.1x. That is roughly 2 turns of headline expansion. If you hold the sector weights at 2015 levels and only let the within-sector multiples change, the weighted average reaches 10.6x. Mix explains about half a turn. The other one and a half turns are pure multiple expansion. In other words: Mix explains only a quarter of the expansion.
Paying Down the Debt
Ludovic Phalippou puts the history plainly. “Traditional LBO models,” he writes, “were designed for a world of 1990s manufacturing companies. Cash flows paid down debt, and that debt amortisation was a central driver of equity returns.”
The last driver is the most dependable, because it leans on nothing but the business itself. After interest, the cash a company generates retires its debt, and every pound off the loan is a pound onto the equity. No growth and no generous buyer required.
But it only works when there is cash to spare. A high entry multiple leaves little, because the “cash-on-cash” yield is low. And the buy-and-build playbook that dominates large buyouts sends what cash there is back out to fund the next acquisition, so the absolute debt never falls.
Phalippou’s own arithmetic exposes this. The leverage ratio still falls, but it falls because EBITDA grows, not because the loan shrinks. It’s a denominator effect. The borrower has grown into its debt rather than paid it down, and the growth was bought, not organic. The company still delevers but value creation depends squarely on reinvestment returns.
The dial is buy-and-build intensity, the share of operating cash a company channels into acquisitions rather than its own loan. Send the cash to the loan and debt falls fast across a hold. Send it to add-ons, as the large-cap roll-up now does, and the loan barely moves even as EBITDA grows. Push the share far enough and the new debt raised against acquired EBITDA outruns the paydown: the deal is releveraging, not deleveraging. On Phalippou’s algebra the cost runs to about a point and a half of annual equity return for every ten points of intensity. Buy-and-build does not only change how a company grows. It changes whether the loan is ever repaid.
The fair objection is that add-ons buy growth, so the comparison is not like for like. True, and that is the point: buy-and-build is a skill, not a strategy. Done well, with add-ons bought cheaply, integrated properly, and realized synergies, it creates real value. Done at any price to justify the platform multiple, it consumes the cash that should have retired the loan. The two look identical in the model. They look nothing alike in a track record. In a market that is fundamentally less forgiving, manager selection is about to become much more important.
Deleveraging is therefore strongest exactly where the other drivers are weakest: at a low entry price, on a business that keeps its cash.
Running the math at European entry levels
Bain’s 14x is the US large-cap multiple. European mid-market clusters around 9x to 11x. Run the same math across that range, holding growth at 5% and leverage at 4.5x EBITDA1, which is closer to where European mid-market deals are.
Sensitivity: MOIC and IRR by entry and exit multiple. 5% EBITDA growth, 4.5x leverage, 5-year hold.
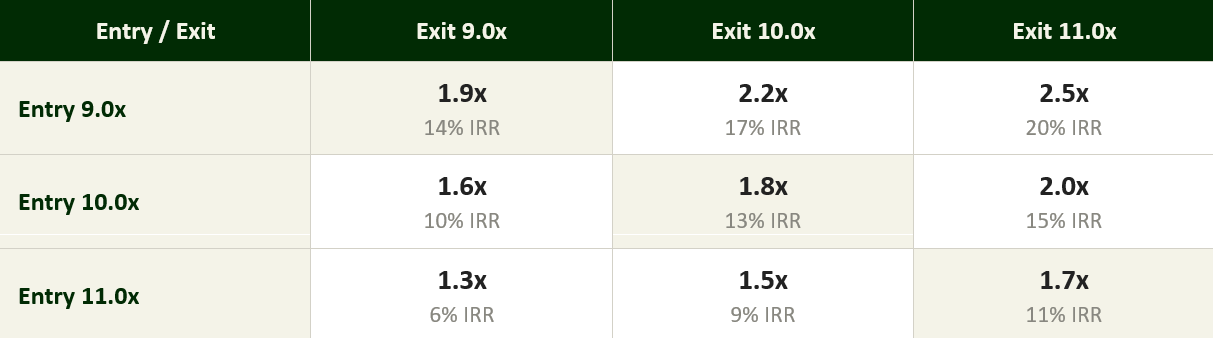
Three things to notice.
The shaded diagonal is the entry-equals-exit case. With constant multiples and 4.5x leverage, deals return 11-14% IRR depending on entry, and that figure is gross. Net of fees the unimproved deal keeps high single digits to low teens, against the 20%+ the asset class has long claimed. Bain’s own returns data, on a net basis, points the same way: over ten years US buyout has trailed the S&P, and over twenty years it leads by only a few points. The illiquidity premium has shrunk to a sliver.
The bear scenario for European deals is the bottom-left reading: 11x entry, 9x exit. That returns 1.3x MOIC and 6% IRR, gross. Net of fees it rounds to the risk-free rate. Equity risk, gilt return.
The discipline is to buy well to protect against the bear scenario. If the deal does not have room at entry equals exit, the price was wrong.
Quality at Any Price
For a decade the mantra shifted by degrees. Buy a quality business at a full price became buy a quality business at any price. And it worked, so the buyer who “paid up” looked right and the buyer who waited lost out. Any price can be defended on paper. You can overpay for the “platform” to get access to a huge pipeline of add-on M&A. Feed the plan into the model and 14x suddenly looks cheap. The entry multiple stops being a signal and returns can be back-solved from what the buyer needs.
How far can you push it? The model won’t tell you but the real world will. This is the boiling frog. Each deal clears a touch above the last, and each one looks fine because the last one did. Then something happens, expectations are reset and the model is suddenly, surprisingly “off”. Software is feeling it first.
Higher Prices, Fewer Options
Higher entry multiples do not just lower expected returns. They narrow the distribution of acceptable outcomes. Nassim Taleb has written extensively on this. When you pay more for the same asset, you hold less optionality.
A deal bought at 14x must grow into the price, exit at a similar multiple, and avoid any operating shock. A deal bought at 7x can underperform on growth, suffer a multiple compression at exit, take longer to sell, and still return capital.
Software is the cleanest illustration. A software business bought at the 2021 peak cleared at 15-20x EBITDA with around 6x leverage. Apollo describes the private equity industry deploying $348 billion into software in 2021, often at peak valuations. A modest growth deceleration does not move the EBITDA much, but it halves the multiple. AI-native competitors are now eating into vertical SaaS incumbents that were underwritten in 2021 against moats that are proving difficult to sustain. Bain’s Midyear Report calls this the SaaSpocalypse: technology deal value fell 70% from the fourth quarter of 2025 to the first quarter of 2026, and private software marks fell again in the first quarter.
The industrial business at 6x EBITDA can absorb each of these shocks individually and still return capital. The software business at 20x can absorb none of them. Higher multiples reduce the dimensionality of the path to success.
What This Means for Credit
For a credit investor, the downside is closer than the LTV ratios or equity cushions suggest. LTV is a comforting concept but easily manipulated. This is the Loan-to-Whatever-You-Want point applied at the entry multiple rather than the EBITDA adjustment. In VCO #2 we showed that lenders were underwriting against EBITDA numbers engineered to support the loan size. Here the same logic operates one level up. Lenders are underwriting against equity cushions calculated from entry multiples detached from fundamental reality.
Stress-test the exit multiple, not just the EBITDA assumption, before underwriting. If the loan does not work at a reasonable exit multiple, the equity cushion is fictional and the credit is mispriced.
The math in the Lower Mid-Market
Apply the same model to the Lower Mid-Market. Entry multiples of 7-9x. Leverage of 3.9x to 4.6x EBITDA. Growth of 5%. Flat exit multiples. The equity returns 2.0-2.3x MOIC and 15-18% IRR.
That number is a baseline, not a ceiling. The model assumes no value creation at all: no growth above trend, no margin work, no well-bought add-ons. Good sponsors beat it, and the Lower Mid-Market gives them more ways to beat it, because smaller businesses have more low-hanging fruit and can change direction more quickly. We are not saying LMM buyouts earn 10% after fees. We are saying even the unimproved deal already works.
That is the whole argument in one comparison. Start at 8x and value creation compounds a healthy base return. Start at 14x and value creation is spent rescuing the entry price. Same idea, same effort, different result. You would start from here.
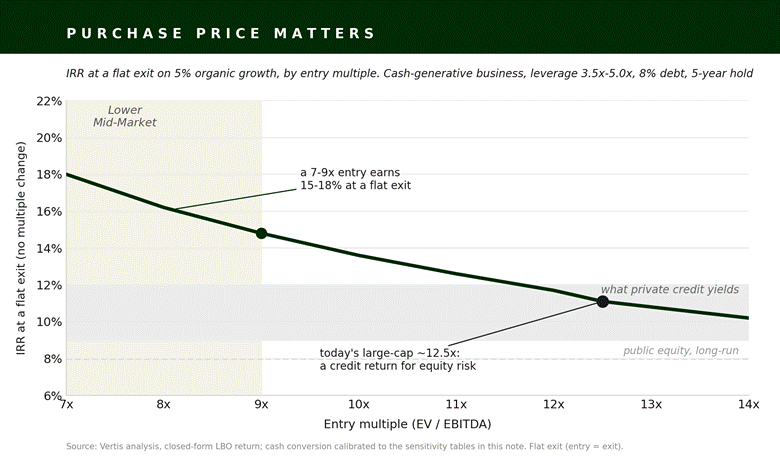
Our base case is that median large-cap entry multiples drift from 12.5x today to 10.0-10.5x over the next three to five years. The 2021-2024 vintages, bought near the peak, work through the system in parallel. The grind continues.
Two and a half years into the long grind, the Dodgeball stance still applies. Dodge, dip, duck, dive and dodge.
None of this is an argument against private equity. The disciplined buyer who pays a sensible entry multiple still earns good returns on equity risk, and the dispersion between top-quartile and bottom-quartile GPs is about to widen sharply, which is why this vintage will reward manager selection more than any in the last decade.
IN CONVERSATION WITH PROFESSOR LUDOVIC PHALIPPOU

Ludovic Phalippou is Professor of Financial Economics and Academic Area Head of Finance at the University of Oxford’s Saïd Business School. His new book, The Science of Valuation in Private Markets: How to Think about Price When You Buy to Sell, was published in March 2026. We are grateful for his time.
Vertis: Your book opens with a clear assertion. In public markets, valuation estimates what an asset is worth. In private markets, it sets the most you can pay and still hit your return over a finite hold. How does price actually get set in a private deal?
Phalippou: Price is set where competing beliefs, constraints, and incentives meet. The valuation model does not determine the price; it disciplines the bid.
A private equity firm starts with a target return, a holding period, an operating plan, a financing structure, and an assumption about what a future buyer will pay. Those assumptions imply a maximum price. Another buyer may have different assumptions and therefore a different maximum price.
The important point is that nobody discovers an intrinsic value and then negotiates around it. They work backwards from a return requirement. Price emerges from a competition between underwriting cases.
This is why private-market valuation is fundamentally different from the textbook DCF world. The question is not “What is this company worth?” The question is “What must be true for this price to work?” The valuation model is simply the consistency check between today’s price and tomorrow’s required return.
Vertis: You have joked that you would send anyone presenting a value bridge to prison. Or perhaps you actually would. People have used this chart to demonstrate that leverage doesn’t matter for PE returns (or even detracts) and to credit EBITDA growth to operational skill when much of that growth is bought, not organic. What is actually going on? And what has turned the classic LBO from a deleveraging story into a releveraging one?
Phalippou: The problem with value bridges is that they often attribute outcomes mechanically rather than economically.
Suppose EBITDA doubles because a company makes acquisitions. The bridge will often call that “operational improvement.” But economically, buying EBITDA is not the same thing as creating EBITDA.
The deeper issue is that leverage does not create value. It magnifies success and failure. It is not additive as assumed / force-fed into value bridge, it is multiplicative.
Historically, LBOs relied heavily on deleveraging. You bought at a reasonable multiple, generated cash, repaid debt, and equity ownership of the enterprise naturally increased over time.
Today’s market is different. Entry multiples are much higher. Organic deleveraging contributes less. Instead, many deals rely on refinancing, dividend recaps, add-on acquisitions, and continued access to credit markets. In other words, the classic story was deleveraging. The modern story is often releveraging.
Vertis: Your decomposition makes the equity return close to linear in the entry earnings yield, the inverse of the multiple, so the price you pay trumps almost every other lever. Bain frames today’s problem as a need for 12% growth, a rate rarely delivered at scale, off a 14x entry and a 15x exit. Why does the industry keep reaching for the growth lever when the price is the one that moves the return?
Phalippou: Because growth is easier to discuss than overpayment.
If you enter at 14x EBITDA, the arithmetic is unforgiving. The earnings yield is low. The starting conditions are simply less favourable than they were when deals were done at 8x.
When returns disappoint, there are only a handful of variables that can rescue the underwriting: faster growth, higher margins, more leverage, or a higher exit multiple. The first sounds the most respectable.
No investment committee wants to hear: “Our plan is to avoid overpaying.” Or “to sell for a higher multiple than we bought at” etc.
The industry talks endlessly about operational value creation because operational plans are actionable. Price discipline requires saying no to deals, and that is much harder institutionally.
Vertis: A value-creation plan, a roll-up, a synergy case can be built to justify almost any multiple on paper, and the model can always be built to agree with it. How much should anyone trust a plan that is used to justify the price, and what happens to those deals when the plan underperforms, is delayed or does not arrive?
Phalippou: A model can always be made internally consistent. That is not the same thing as being correct.
One of the central messages of the book is that models are planning devices, not forecasting machines. A model tells you what assumptions are required to justify a price. It does not tell you whether those assumptions are realistic.
Whenever a plan is being used to justify a price, I would ask a simple question: what happens if execution is slower, margins do not expand, acquisitions cost more, or the exit multiple falls?
Good underwriting is not about the base case. It is about understanding how much disappointment the deal can absorb before the return collapses.
The danger is that as entry prices rise, the underwriting becomes increasingly dependent on everything going right. The model still works. Reality becomes less forgiving.
Vertis: Almost every sponsor case assumes margin expansion over the hold. Jeremy Grantham has argued for decades that profit margins are the most mean-reverting series in finance, yet they sit near records with no obvious reversion in sight. Does that mean the asset class is implicitly underwritten to peak margins persisting, and what should LPs make of that?
Phalippou: The key question is not whether margins are high today. It is whether today’s price already assumes they remain high tomorrow.
Many investment cases now rely on some combination of sustained margins, margin expansion, and multiple stability. That can work, but investors should recognise that they are implicitly underwriting a very favourable future state of the world.
Historically, competition has tended to compress excess profitability. That does not mean margins must revert immediately. But it does mean that assuming permanent improvement deserves scrutiny rather than acceptance.
For LPs, the discipline is straightforward: separate operational improvements that management can plausibly control from assumptions that depend on favourable market conditions. The latter deserve much larger discounts in underwriting.
Vertis: Your book argues that a portfolio mark should be an update of the entry underwriting, anchored to the entry-implied return, not an exercise in manufacturing fair value. With distributions at multi-decade lows and continuation vehicles absorbing assets that will not sell, how much of the industry’s reported performance today is realised cash rather than marks, and what should an LP believe? Describe a valuation process that would help establish trust and transparency in the industry.
Phalippou: The most important distinction in private markets is between cash and estimates.
NAV has always existed, but historically it mattered less because closed-end funds eventually realised their investments through exits. Today, distributions are lower, holding periods are longer, and more performance exists as marks rather than cash.
That does not mean the marks are wrong. It means they deserve greater scrutiny.
A useful valuation process begins with the original underwriting. What return was implied at entry? Given everything that has happened since then, what return is implied today? Have revenues, margins, leverage, and market conditions evolved in a way that supports that change?
In my view, valuation should be an update of underwriting rather than an exercise in manufacturing a hypothetical fair value every quarter (which is the current industry guidelines!).
Trust improves when managers show the bridge from original assumptions to current assumptions and explain what has changed economically, not merely what multiple was selected.
Ultimately, realised cash remains the final arbiter.
Vertis: Capital has been pouring into large-cap secondaries, drawn by the discount and the diversification. But the diversification strips out manager selection, and what remains is a clean expression of PE beta, bought at a tight discount and carrying an extra layer of fees, at a moment when initial conditions appear unfavourable. Why is the money rushing toward broad PE beta exactly when that beta looks the least rewarding?
Phalippou: Because investors often focus on the discount and not on the asset being discounted.
A 10% discount can be attractive. But a discount is not value in itself. The question is always: a discount to what? If that NAV is too high, that discount may be a premium. Plus, the NAV it is computed from is 3-6 months old, so just that makes it a very odd figure to look at.
Large diversified secondary portfolios reduce manager-selection risk, which many investors like. But they also leave investors increasingly exposed to the underlying economics of the asset class.
If broad private-equity beta is being purchased at historically elevated valuation levels, then a small discount may not compensate for weaker future returns.
I suspect much of the demand reflects a search for scale, diversification, and deployment capacity. Those are understandable objectives. But they should not be confused with a compelling return opportunity.
The mathematics of buying earnings at high multiples does not disappear simply because the assets are purchased in a secondary transaction at a discount of an old NAV.
Vertis: A question for credit investors. If you are lending against businesses bought by sponsors at multiples that look structurally inflated, what is the single underwriting discipline you would have every credit committee enforce?
Phalippou: Every credit committee should ask one question: if the equity thesis fails, do we still get our money back?
That means stress-testing earnings, valuation multiples, refinancing conditions, and time. Not just leverage.
Credit investors’ job is not to believe (or even discuss) the GP optimism. Their job is to survive without it.
The discipline I would enforce is simple: assume the growth case disappoints and ask whether the capital structure still works. If the answer is no, move on. Forget about your 3-5% fee. It hurts now, but otherwise it will hurt a lot more later.
Vertis: Thank you very much.
Where the math leaves us
Private markets have been overextended during 2020 to 2024. We are now in a long and drawn-out normalisation phase. We believe a risk-averse posture with an in-built margin of safety is warranted.
In this market the equity-credit gap shrinks. The baseline logic cuts both ways. Every sponsor starts from the unimproved deal and adds value on top. The Lower Mid-Market starts from 15-18% gross. Large-cap at today’s multiples starts from single digits, and in the bear case from gilts. Value creation at 14x is one long uphill climb. Net of fees, many large-cap funds will struggle to clear the 8% hurdle rate. VCS, our opportunistic ABF strategy focused on the Lower Mid-Market, targets 12-14% net.
At Vertis we are building the leading credit platform for Europe’s Lower Mid-Market. We are doing this across cash-flow lending via our strategic partnership with DunPort Capital Management and asset-backed lending via Vertis Capital Solutions.
1 Leverage conventions differ. Bain and Phalippou state it as debt over enterprise value, 36% and 65% respectively. We state it in turns of EBITDA. At 9x to 11x entry, 4.5x EBITDA is roughly 41% to 50% of enterprise value, between Bain’s 36% and Phalippou’s 65% base case.