
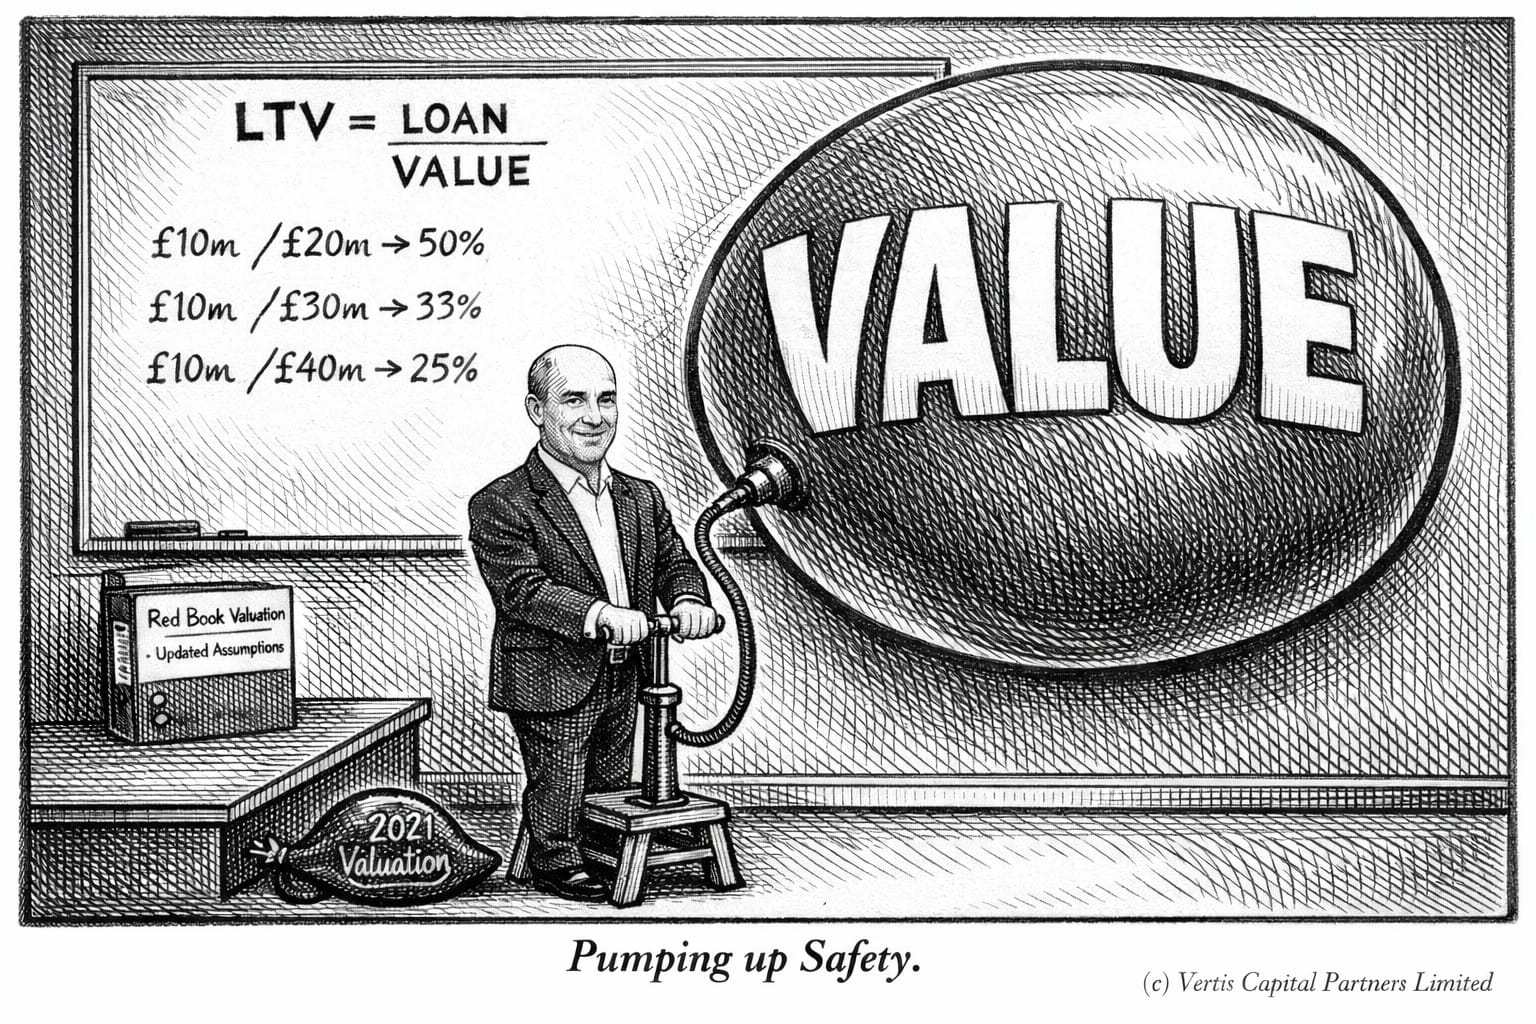
Loan-to-Whatever-You-Want
Or: What's the Value in Loan-To-Value?
The question we get asked most often when we present our European asset backed capital solutions strategy (Vertis Capital Solutions or "VCS") is: "What is the Loan-to-Value you lend at?" This is an innocent enough question. Our initial answer is we typically lend at 50-75% Loan-to-Value ("LTV") but there are occasions we can go higher (or, of course, lower) bearing in mind that we always underwrite to full recovery in our base case. For some investors 50-75% LTV sounds high; after all many private credit funds lend at 40-50% headline LTV. Many NAV lending funds lend at 25%. Every private credit deck we review quotes an LTV ratio. It is an intuitive metric, easily understood and meant to give you a quick view of the size of cushion sitting between your loan and a loss. It is also in our experience the metric most routinely manipulated, misunderstood, and - in many cases - entirely undefined. In today's newsletter we are looking to highlight some of the common pitfalls and shed some light on how we look at LTV.
A note on intent: We write the Credit Observer to sharpen our own thinking and to hold ourselves accountable to the standards we set. This article is not a criticism of any specific manager or strategy. The "V" in LTV is a genuinely hard problem and reasonable people can disagree on methodology. Our view is simply that greater clarity and consistency in how LTV is communicated would benefit the entire industry as private credit matures. We welcome feedback and the debate.
The typical direct lending firm will argue they lend somewhere between 40% and 50% LTV. Why? Because the typical Upper Mid-Market PE transaction occurs at 12x EBITDA and the lender in question lends at 5-6x EBITDA. Easy enough. That, however, has nothing to do with LTV.
When somebody asks you about LTV they typically ask two questions in one (i) what is the loan amount you lend and (ii) what do you think the asset is worth. That is at least how we treat the question. To quote Buffett: Price is what you pay, value is what you get. Or Marc Rowan: Purchase Price Matters.
The numerator is easy. Hopefully you know how much you are lending. The denominator is hard. It is a judgement call. Let's illustrate this with an example from real estate which demonstrates how different approaches to determining "value" can result in a wide range of LTVs.
We came across a situation where the borrower needed €50M to refinance stabilised residential and commercial assets and development assets across Europe. The borrower had used aggressive cap rates to value the residential and commercial assets which were based on just two recent transactions while the development assets consisted of entitled land that needed development financing to be built. The borrower implied an equity value after these were developed and added this to their valuation.
The borrower's valuation resulted in an LTV of 40%. The real estate broker they hired came up with a valuation closer to 60% LTV, which was based on more conservative cap rates while still placing some value on the development assets.
Our analysis started by placing no value on the development assets and therefore zero value on the equity of each potential development. We then used a "through-the-cycle" cap rate for the residential and commercial properties rather than just the two precedent transactions to reach what we believed was a "liquidation value" if we had to enforce and sell these assets in a short timeframe.
VCS' valuation meant the LTV changed from an initially marketed 40% to closer to 80%...at which point we requested an equity injection to bring this down to 70% and within our comfortable threshold.

The difference is not the risk but the methodology. That is not the end of it. LTV is always and everywhere a dynamic phenomenon. You need to consider how it changes over time, how your capital structure evolves over time, and if your relative position improves or deteriorates over time. The longer the loan duration, the harder it is to set the right structural boundaries over time. At VCS we focus on transitional capital with three year weighted average loan life for that reason.
Some other watch-outs lenders should focus on:
(i) Stale valuations. This one is self explanatory but apart from there usually being an incentive of asset owners to overvalue their assets there is also an incentive not to update stale valuations if they are higher than current market values.
(ii) Inflated denominators. If a business is valued based on a current "market" EV / EBITDA and the EBITDA itself is heavily adjusted "value" can be doubly inflated, significantly diminishing the margin of safety.
(iii) Cash-flow & PIK interest. An asset with strong cash-flow naturally de-levers and a loss-making asset re-levers. Similarly a second-lien PIK note can eat away the remaining equity value rather quickly.
(iv) Legal protections / documentation. Any form of collateral extraction or layering can quickly balloon your LTV and in turn diminish your equity cushion.
(v) Capital structure and selective collateral inclusion. Some managers include all assets in the denominator - including those where they only hold a second charge or those which are still under construction (development assets). Others treat additional collateral that's not first ranking as helpful boot collateral but don't include it in LTV. NAV managers lending against equity usually completely ignore any debt and calculate their loan only against the equity value (20% LTV anyone?).
(vi) Attachment points. We spend a lot of time talking about attachment points. Attachment point is the point where your tranche / risk starts and detachment point is where it ends. A 60% LTV loan that is senior secured has an attach/detach of 0% and 60%. If the same loan is back-levered 80% the attach/detach changes to 48% and 60%. A 50% impairment on the underlying asset would result in an 83% recovery (17% LGD) in the first case but only a ~17% recovery (83% LGD) in the second scenario.
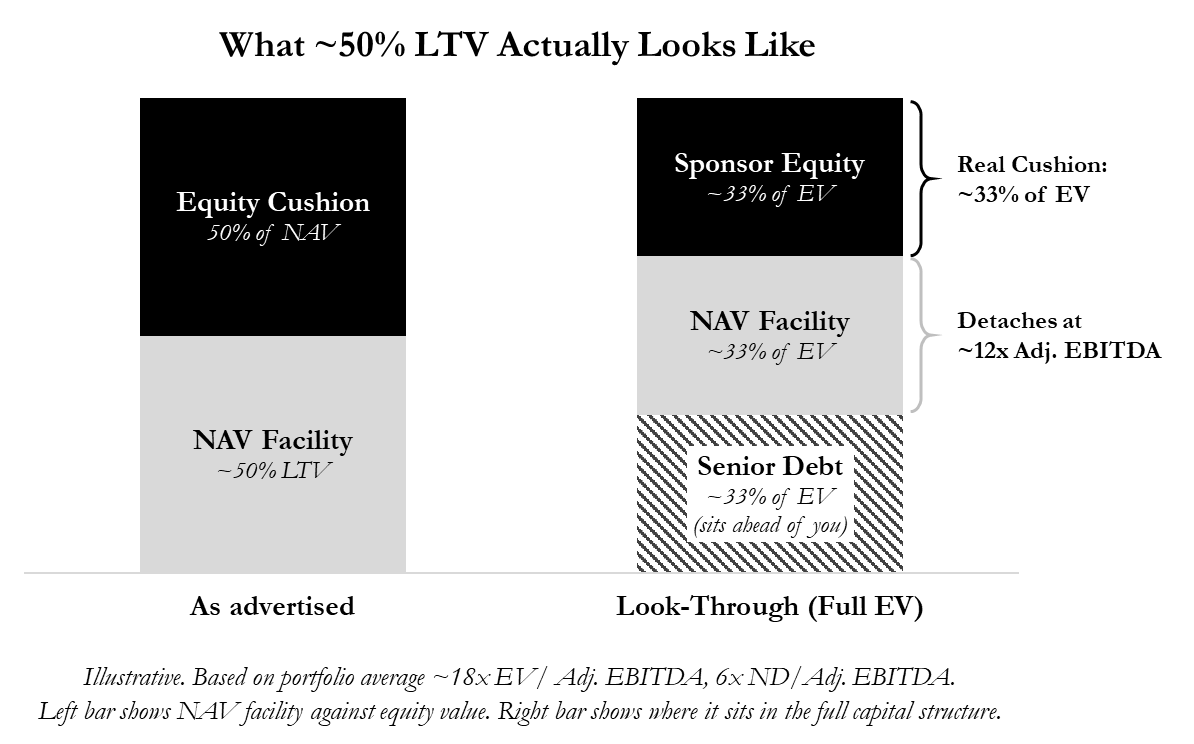
Here is an example where several of these factors are at play: Let's assume there is a NAV facility against a portfolio of PE assets. The facility is structured at ~50% LTV. The average valuation multiple of the underlying companies is 18x Adjusted EBITDA. Average leverage is 6x Adjusted EBITDA - but the adjustments are meaningful, and some of the companies are closer to 10x levered on unadjusted numbers. Strip out the senior debt that sits ahead of you in each company, and the facility detaches at something like 12x Adjusted EBITDA on the enterprise value of the underlying businesses. That is not 50% LTV. It is closer to 100% (or more). It gets worse if the facility is structured as PIK as it will further grow into the underlying NAV over time (Note: any potential similarity with any real world NAV loan is purely coincidental).
How we think about it
So what do we mean when we say we typically lend at 50-75% LTV in our ABF strategy? We think of LTV as having an asset side and a structure side. The asset determines the range; the structure determines if we lend at all and where in the range we are comfortable.
Asset-side factors (what sets the LTV range): Collateral quality, covenant strength, liquidity/duration, diversification/granularity.
Structure-side factors: Covenant suite, legal structuring and oversight, enforcement route, credit enhancement (credit insurance, guarantees, cash traps).
A diversified pool of short-duration receivables with investment-grade counterparties can support a 95% advance rate and carry less risk than a single concentrated real estate asset at 50%. The headline LTV alone tells you almost nothing about relative safety. Conversely, a pristine asset at a low LTV means nothing if the documentation allows unlimited layering and leakage.
Secondly we look at fundamental value through-the-cycle and not what a marginal buyer just paid in a hotly contested auction. We use our judgement from our collective 50+ years of distressed investing and restructuring experience to define a prudent value to lend against.
Finally, we always look at where we would own an asset in a downside scenario. A 70% LTV loan against a super prime multi-family asset in Hamburg might sound safe but if the initial purchase was at a 2.5% cap rate you as lender could be the proud owner of the building at a 3.6% look-through cap rate. Not a good idea.
So what is the Loan-to-Value we lend at? Typically it is 50–75%. But now you know what that means - and more importantly, you know what to ask the next manager who gives you a number without the methodology behind it.
THREE QUESTIONS FOR:
...a senior finance partner at a leading London law firm. He answered off the record.

Vertis: Within your field, what are the most common valuation adjustments you see embedded in facility documentation - and how material can they be? Is this a rounding-error problem or a structural one?
Partner: The most frequent valuation adjustments we see in private credit documentation arise in the definition of EBITDA, particularly the expanding scope of permitted add-backs. What started as relatively contained adjustments for restructuring costs and genuinely non-recurring items has, in many deals, developed into a far more elaborate framework. It now commonly includes projected cost savings, anticipated synergies (both cost and revenue), and run-rate adjustments tied to new contracts, sometimes without robust caps or time-based limitations.
These adjustments can be highly consequential. The gap between reported EBITDA and the “adjusted” figure may be material, and those numbers typically flow directly into leverage covenant testing and borrowing base mechanics. In practical terms, this can operate as a structural feature that reshapes the credit’s risk profile from day one, potentially overstating capacity and understating leverage at origination.
Vertis: When loans have restructured or defaulted, have there been particular examples where leakage or layering - whether through permitted payments, additional debt, or structural subordination that wasn't visible at origination - materially eroded the recovery versus what the original LTV implied?
Partner: We have seen transactions where recovery outcomes diverged materially from what the original loan-to-value ratio might have implied. In a number of those situations, the drivers included permitted leakage and structural layering, features that can be difficult to identify at origination or that later emerge through the use of documentary flexibility. Restricted payment capacity is a recurring consideration, including sponsor value extraction through dividend recapitalisations within permitted baskets, which can reduce resilience in the capital structure over time. Similarly, incremental debt provisions may allow borrowers to incur additional obligations that, while senior or pari-passu in form, can dilute the recovery pool in practice.
We have also observed cases involving asset transfers to unrestricted subsidiaries or the movement of valuable intellectual property beyond the secured creditor perimeter. While such transactions may be permitted under the documentation, they can leave lenders with security over a reduced asset base. The broader takeaway is that headline LTV metrics are most meaningful when paired with covenant protections that help preserve the collateral package throughout the life of the loan.
Vertis: Facility documentation has become increasingly bespoke - with carve-outs, adjustments, and highly specific definitions and exclusions around valuation mechanics. Are there areas where greater standardisation would be helpful, and how might the market go about achieving it?
Partner: One area where greater standardisation could meaningfully benefit the market is the treatment of EBITDA adjustments. Some flexibility is clearly appropriate, but the current position (where definitions can vary significantly, sometimes even across credits backed by the same sponsor) can make like-for-like comparison difficult. More consistent, market-oriented principles around permissible adjustments, including clearer caps and time limits on projected synergies and cost savings, would help improve transparency and comparability.
Achieving that level of standardisation is not straightforward. Industry bodies such as the Loan Market Association have helped to develop and promote certain market conventions, but private credit remains, by design, more bespoke. In practice, momentum is most likely to come from a combination of investor expectations and sponsor recognition that more aggressive drafting can affect perceived risk and, in turn, the availability or cost of capital. Regulatory engagement may also play a part, although any approach would need to be carefully calibrated so as not to undermine the flexibility that is central to the asset class.
Vertis: Thank you very much!
At Vertis we are building the leading financing platform for Europe's Lower Mid-Market. We are doing this across cash-flow lending via our strategic partnership with DunPort Capital Management as well as asset-backed lending via Vertis Capital Solutions.
Published by the Investment Team at Vertis.